

Data Source Configuration
1 An Introduction to Data Sources in Ingenuity 7
Section titled “1 An Introduction to Data Sources in Ingenuity 7”Ingenuity is Eigen’s digital platform for Engineering and Industrial Operations. It is built by Engineers, for Engineering and Asset Managers to make working with data a joy. The Ingenuity platform was first written in 2009 and now, 15 years on, Ingenuity 7 is a major new release; a complete re-write from the ground up to include the latest and best technology and incorporate all the learnings we have from over 17 years deploying digital capability for Oil & Gas, Energy, Chemicals and Manufacturing industries. It’s faster, more secure and more intuitive than ever before.
There is a publicly accessible demo of Ingenuity 7 available at https://ingenuity-sandbox.eigen.co/.
1.1 What is Ingenuity?
Section titled “1.1 What is Ingenuity?”Eigen Ingenuity is a digital platform for getting value from data, improving decision making and automating labour intensive work processes.
It is a layer on top of existing systems and makes it easy way to combine, visualise, publicise and share information from existing systems through online charts, dashboards, reports and automate workflows.
There is no requirement to copy data to a data lake or replace the underlying systems. It is also agnostic, so it is easy to roll out capability across sites with different systems.
1.2 What is a Data Source?
Section titled “1.2 What is a Data Source?”Ingenuity data sources provide the information displayed in charts, dashboards, tables, and other visual elements.
Ingenuity comes with a number of data source templates that can be installed and configured locally. It is also possible to add a custom data source (see section 3).
1.3 Types of Data Source
Section titled “1.3 Types of Data Source”There are 3 types of data source:
-
Web API
-
Driver based
-
Timeseries Historian
Web API data sources
Section titled “Web API data sources”Web API data sources are the simplest to set up and can be configured directly via the Ingenuity Hub. They can connect to any Web API data source and allow the inputs and results to be exposed to the UI so that a user can interact with it. See Appendix 1 for an example.
Driver based data sources
Section titled “Driver based data sources”Driver-based data sources connect directly to external systems like SQL Server, SAP, and Oracle that need special software to access them. These systems typically use their own connection methods rather than web-based ones, and have specific security requirements such as ODBC connections. The drivers handle the technical details needed to work with each unique data system and often provide more features than a web API would. To use these sources with Eigen Ingenuity, you must first install and set up a driver, then configure the connection through Ingenuity Hub.
Timeseries Historian data sources
Section titled “Timeseries Historian data sources”Timeseries Historian data sources are a special case of a Driver based data source and are required to connect to a data source that provides timeseries data, such as Aveva PI, Aspentech IP.21, InfluxDB etc. Data in an SQL database can also be exposed as timeseries data using the Eigen SQL Historian driver. A timeseries data source is required by the Calculation module. Further details on the Timeseries Historian data source are given in section 1.4 below.
1.4 Timeseries Historians — a special type of data source
Section titled “1.4 Timeseries Historians — a special type of data source”Timeseries Historian data sources support the full range of functionality available in a true data historian. This means:
-
Raw and interpolated data
-
Aggregate functions
-
Optimised retrieval of time-ordered data
The Eigen Calculation Historian is itself a Timeseries Historian data source within Ingenuity and can only perform calculations on other timeseries historian data sources.
All timeseries historians are presented to the user through the “Historian Multi” data source and data within them is addressed with the following syntax:
Historian_Instance/tagNameFor example:
Ip21/21PST12345.value\onshore-pi/ONS_13FIT4321.X1.4.1 Timeseries historian data source architecture
Section titled “1.4.1 Timeseries historian data source architecture”The Historian Instance is configured in the Ingenuity back end and requires the Eigen driver for the underlying data historian. This Historian Instance is then registered in the Historian Web API server The Historian Multi data sources in the UI connects to the Historian Web API and makes the data from the Historian Instances available.
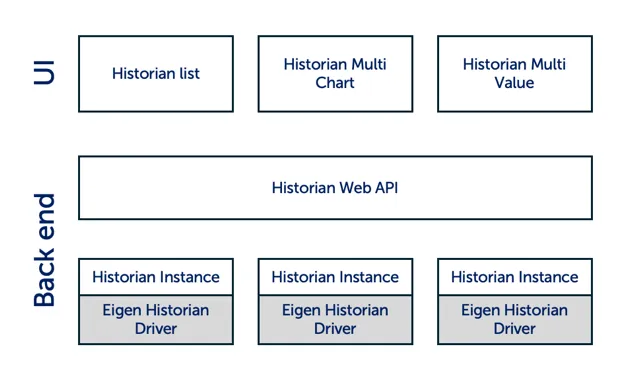
The Eigen Historian Drivers are separately licenced components that enable seamless integration of the different data historians. They are available for:
-
Aspentech IP.21
-
Aveva PI
-
Cognite CDF
-
InfluxDB
-
SQL databases
1.5 Data source compatibility
Section titled “1.5 Data source compatibility”A data source can be compatible with the following types of component:
-
Value: returns a single value at the requested time. Can be used by dashboard components that display a value at a point in time.
-
Multivalue: returns a set of values at the requested time. Can be used by dashboard components that display a value at a point in time.
-
Table: returns a dataset with column headings and rows. Can be used to drive a DataTable component in a dashboard.
-
Chart: returns one or more datasets with “x” and “y” values that can drive a chart or sparkline component. The time is always the “x” value and the “y” values can have any name.
Future releases of Ingenuity will also support map & sunburst components
1.6 Viewing available data sources
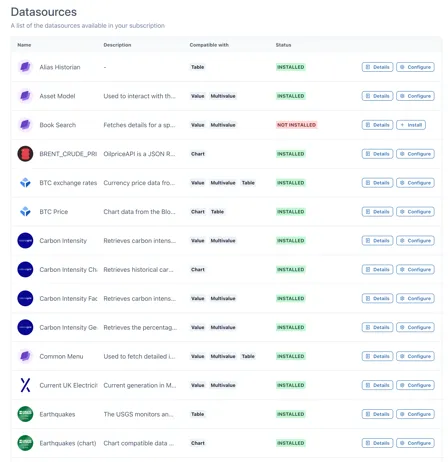
Section titled “1.6 Viewing available data sources”The list of available data sources can be accessed from the “Data sources” module in the left hand navigation panel:
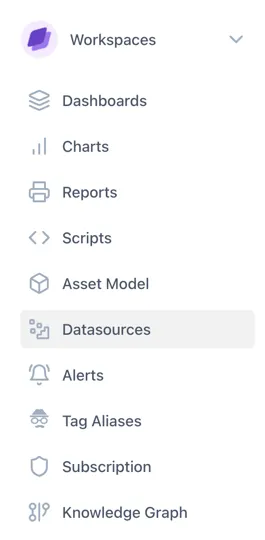
This will bring up the list of available data sources and whether they are installed or not. It also shows the types of component that can use that data source (value, multivalue, table & chart.
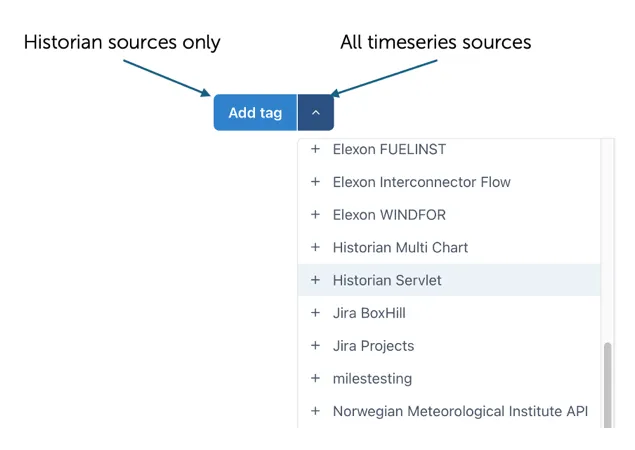
1.6.1 Data sources in a Chart
Section titled “1.6.1 Data sources in a Chart”Clicking on the “Add tag” button in a Chart will automatically bring up the search form for Historian Timeseries data sources. The dropdown menu on the right of the button will list all compatible Timeseries data sources
1.7 Installing a data source
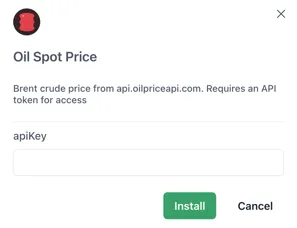
Section titled “1.7 Installing a data source”Data sources are installed (from Data source Templates) via the Data sources module by clicking on the “Install” button at the right hand side.

This will then bring up details of the data source with an input field for any parameters required, for example an Api key. Enter the required information and click on “Install” to install the data source
2 Comparison Table of Data Source Types
Section titled “2 Comparison Table of Data Source Types”This section summarises the differences between a Timeseries Historian data source and other data sources.
| Timeseries Historian | Driver Based (e.g SQL) | Web Api | |
| Charts | ✅ | ✅ | ✅ |
| Values | ✅ | ✅ | ✅ |
| Tables | ✅ | ✅ | ✅ |
| Use in calculations | ✅ | - | - |
| Interpolated data | ✅ | - | - |
| Requires driver | ✅ | ✅ | - |
| Search tags | ✅ | - | - |
| Data Source name | Historian Multi | any | any |
3 Creating a New Data Source
Section titled “3 Creating a New Data Source”Ingenuity 7 comes with an ever-expanding library of data sources that can be installed at the click of a button. However, if the one you need is not available, or you have created a new custom data source in the Ingenuity Scripts module, they you can create a new data source template in your instance and install it.
3.1 Defining and installing a new data source
Section titled “3.1 Defining and installing a new data source”New data sources must first be created as a new Datasouce Template in Ingenuity Hub. You must be configured as an Administrator of your Subscription in order to be able to create new Data source Templates. There are four steps to creating a new data source, with the first step only required for Driver based data sources:
-
Install and configure the relevant Eigen Ingenuity driver (not required for Web APIs)
-
Create a new Datasource template
-
Configure the new Datasource template
-
Install the new datasource in your subscription
3.1.1 Step 1: Install the relevant Eigen Ingenuity Driver
Section titled “3.1.1 Step 1: Install the relevant Eigen Ingenuity Driver”For data sources that require a driver, this must be installed and configured in the Ingenuity back-end by a system administrator. See section 5 for details.
3.1.2 Step 2: Create a new Data source Template
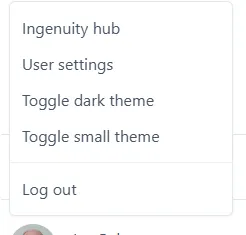
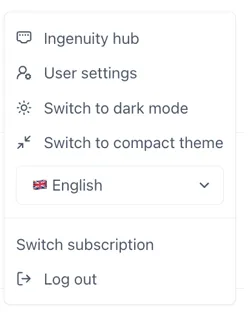
Section titled “3.1.2 Step 2: Create a new Data source Template”To access this, click on your account name in the bottom left corner of the screen and choose Ingenuity hub from the pop-up list that appears.
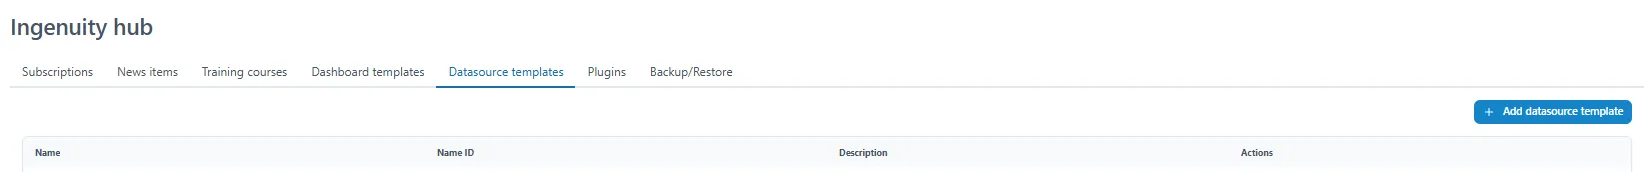
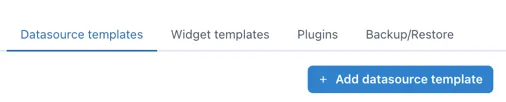
Select the “Datasource templates” tab in the Ingenuity hub:
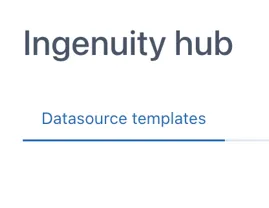
And finally, click the “Add data source template” button in the top right corner.
3.1.3 Step 3: Configure the new Data source template
Section titled “3.1.3 Step 3: Configure the new Data source template”New data source templates open with the following blank JSON configuration:
{ "url": "https://dummyjson.com/products/{{num}}", "type": "GET", "inputs": [ { "name": "num", "type": "url", "label": "Product number", "description": "The number of the product to fetch", "isRequired": true, "isHidden": false, "isConfigurable": false }, { "name": "test", "type": "get", "label": "Test", "description": "A test option", "isRequired": true, "isHidden": true, "isConfigurable": true } ], "output": { "paths": [ { "name": "price", "path": "\$.price" } ] }, "useProxy": false, "compatibleWith": ["value", "multivalue"]}Replace the dummy data with the information for your data source. See section 3.2 for all the available configuration options
3.1.4 Step 4: Install the data source
Section titled “3.1.4 Step 4: Install the data source”Install the data source as described in section 1.6.
3.2 Configuring a Datasource template JSON
Section titled “3.2 Configuring a Datasource template JSON”A Datasource template is a JSON document with metadata that defines how to retrieve data from a specific source. The configuration includes details about the source URL, necessary input parameters, and the structure of the output data. Below is a description of key parameters
3.2.1 Metadata
Section titled “3.2.1 Metadata”The data source template metadata defines the ID, name, description and icon for the data source that will be visible to users.
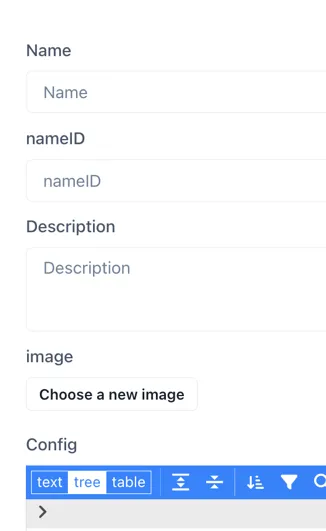
Name: Mandatory. This is the text that will identify the data source to users. It should be something descriptive and meaningful, but not too long!
nameID: Mandatory. This is the machine-friendly name of the datasource that will be used by the code. It should be fairly short and not contain any spaces.
Description: Mandatory. This will appear in italic text below the data source name in an drop-down boxes. The description should contain as much detail and relevant information as possible. If there are any limits (e.g. number of requests per day) using the API, this should be mentioned here.
Image: Optional. Uploading an image makes it easy for users to identify the data source. The image will be cropped to a circle so it is best to start with a square image if possible. The image can be a png, jpg or svg.
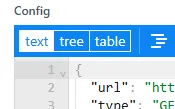
3.2.2 Configure the data source
Section titled “3.2.2 Configure the data source”The config section is where the connection to the data source is defined. The easiest way to edit the the set-up is in text mode. To get into text mode, simply click on text in the top left of the config box:
The data source is defined as a JSON document. The main sections to complete are:
url: The API request’s base URL, supporting path parameters wrapped in {{ }}.
Type: Defines the HTTP method used for the request, supporting: GET, POST & POST_FORM
Inputs: {} An array defining the path parameters that will be provided to the API.
Output: {} Define the data that the data source template will return. This is typically a subset of the data the API returns.
Useproxy: true or false. Defines if the the API request must be sent via a proxy
compatibleWith: value|multivalue|chart|table defines the data source compatibility (see section 1.5) - the - types of component that can use the data provided by this API.
There are a number of additional parameters that can be added to further refine how the datasource behaves. The full template (typescript) definition for a data source is given in Appendix 1, and full details for each parameter are laid out in Table 3.1
Inputs JSON config
Section titled “Inputs JSON config”Path Parameters are dynamic placeholders inside the URL path. They allow API requests to be flexible and retrieve specific resources based on the provided values.
name: Required. A string representing a machine-friendly name for the input, e.g., “AIRPORT_CODE” or “tag”.
parameterName: The name of the parameter as it appears in the URL or request body, e.g., “arr_iata” or “tag”. As you requested, this should be the parameter name itself, like “timeZone”.
type: Required. Specifies where the input parameter should be placed in the request. Possible values are
“body”; to be used in conjunction with POST_FORM request type
“url”; the parameter will be substituted for the {{placeholder}} enclosed in double curly brackets in the URL e.g. foo.io/{{bar}}
“get”; the parameter will be appended to the url (i.e. the URL string [does not]{.underline} need to include ?bar={{bar}})
“header”; parameters that will substituted into the the header section if configured, for example authorisation tokens
“json”; can be used in conjunction with the POST request type
format: An optional object that defines the format of the input value, especially useful for dates. It can include:
type: The data type, e.g., “date”.
pattern: The format pattern for dates, referencing https://date-fns.org/v2.30.0/docs/format, e.g., “yyyy-MM-dd’T’HH:mm:ssXX”.
timeZone: The timezone for date inputs, e.g., “CEST”.
label: A user-friendly label displayed above the input field in the UI, e.g., “3 letter airport code, e.g. LGW or JFK” or “Tag”.
default: The default value to use if the user does not provide an input.
multi: A boolean indicating if multiple values can be selected for this input.
encode: A boolean indicating if the input value should be URL-encoded.
transform: An optional string to specify a specific transformation for this input, e.g., “transformSmartdashInput”.
isRequired: A boolean indicating if this input is mandatory.
isAdvanced: A boolean indicating if this input should be hidden under an “Advanced” section in the UI. Defaults to false if omitted.
isChartStart: A boolean that, if true, indicates this input will use the chart’s start time. Only one input can have this set to true, and it applies only to data sources supporting charts.
isChartEnd: A boolean that, if true, indicates this input will use the chart’s end time. Only one input can have this set to true, and it applies only to data sources supporting charts.
isHidden: A boolean indicating if the input should be hidden from the user interface but still configurable.
isCode: A string that, if set to “sql”, will display an SQL formatted text box for user input.
isConfigurable: A boolean indicating if this should be shown as an input during data source installation.
showBasket: A boolean indicating if this input can be added to a basket (presumably for bulk actions).
showTagEdit: A boolean indicating if a search icon should be displayed for this input, likely for searching tags.
showStaleAfter: A boolean that enables a staleness indicator for components using this data, useful for live or frequently changing data.
When to use which input parameter type
Section titled “When to use which input parameter type”URL
Use the “url” type when the parameter is part of the url path — i.e. a path parameter. Path Parameters are dynamic placeholders inside the URL path, for example;
https://foo.com/products/{{num}}/itemUrl parameters must set as required;
isRequired: trueGET
Use the “get” type for query parameters that will be appended to the url as key-value pairs, for example;
https://foo.com/products?item=numGet parameters can be either optional or required.
JSON
json will go with POST
BODY
body will go with POST_FORM (edite
Example Usage
If an API needs to fetch product details by product ID, the URL might be structured as follows:
'url': 'https://dummyjson.com/products/{{num}}''Inputs':[ { "name": "num", "type": "url", "label": "Product number", "description": "The number of the product to fetch" }]Outputs JSON config
Section titled “Outputs JSON config”An object defining the data that the data source template will return. It contains:
paths: An array of objects, where each object defines an output field. Each object has the following fields:
name: Required. A human-readable name for the output field.
path: Required. A JSONPath1 expression to locate the desired value in the API.
type: The data type of the output value, e.g., “date”.
label: Helpful text to display to the user for this output field.
default: The default value if no value is found in the API response.
format: An optional object to define the format of the output value, especially for dates, with type and pattern fields similar to input formats. For
Example Usage
This example returns a the values and timestamps and formats the timestamp to work with a chart component:
"output": { "paths": [ { "name": "generation", "path": "$.*.generation" }, { "name": "x", "path": "$.*.startTime", "format": { "type": "date", "pattern": "yyyy-MM-dd'T'HH:mm:ssXX" } }]Other JSON config
Section titled “Other JSON config”transform: An optional string specifying a transformation function to apply to the output data, such as ‘transformSmartdash’, ‘transformHistorianServlet’. Transforms are necessary when the API response is complex and cannot be parsed into the outputs required with JSON path expressions alone. Transforms are pre-built , secure, code libraries within Ingenuity 7 that perform a dedicated function. It is not possible for users to write their own transforms.
headers: An optional object containing key-value pairs representing custom headers to be included in the API request, such as “Authorization”.
useProxy: A boolean indicating whether the API request should be sent via a proxy. Defaults to false.
trendWith: An optional string specifying the data source ID of another data source that provides a trendable version of the same parameter.
compatibleWith: An array of strings defining the types of components that can use the data from this data source. Possible values include “table”, “chart”, “value”, and “multivalue”.
batchSize: An optional number specifying the batch size for requests.
isTrendable: An optional boolean indicating if the data from this source can be used in trends.
isWriteable: An optional boolean indicating if data can be written back to this source.
errorPath: An optional object defining the path to error information in the response.
format: An optional object defining the overall format of the API response, such as “json” or “csv”, with associated options (e.g., “delimiter” for CSV).
concurrentSize: An optional number specifying the number of concurrent requests.
isUnique: An optional boolean indicating if the data should be unique.
writeWith: An optional string specifying another data source ID to use for writing data.
function: An optional function to be executed for data retrieval or transformation.
3.3 Testing the data source
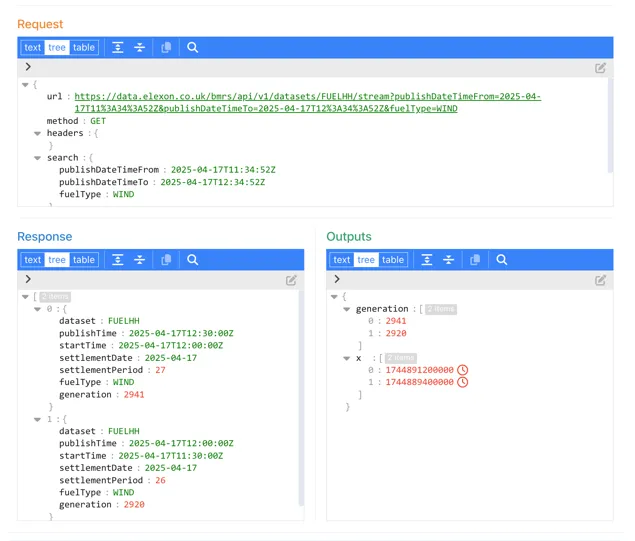
Section titled “3.3 Testing the data source”Once the configuration is complete, you can test the data source using the Preview section below the config window. Enter any required input parameters and click the “Test” button.
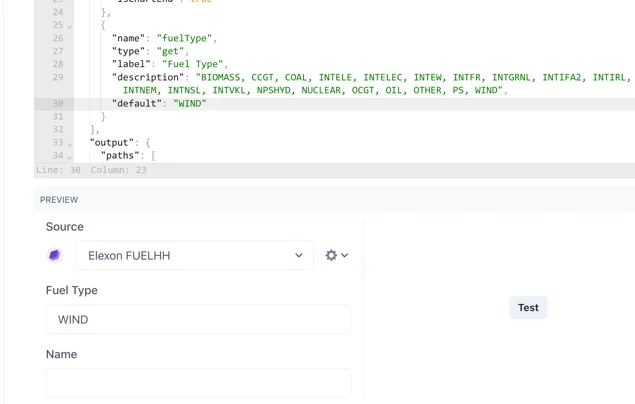
A new panel will appear below showing the request sent, the response received back and the resulting Outputs according to the configuration. This lets you troubleshoot any errors and make sure the output is configured correctly.
3.4 Reference table of all data source configuration parameters
Section titled “3.4 Reference table of all data source configuration parameters”The following table lists all the available configuration parameters along with their purpose and possible values
| Path | Parameter name | Data Type | Required | Possible values | Examples | Default | Purpose |
|---|---|---|---|---|---|---|---|
| url | url | string | Yes | Any valid URL | "https://api.carbonintensity.org.uk/generation", "https://dummyjson.com/products/{{num}}" | - | Defines the base URL for the API request, supporting path parameters wrapped in {{}} |
| type | type | string | Yes | ”GET”, “POST”, “POST_FORM” (POST_FORM requires the content to be sent as a form rather than a json object) | "GET", "POST" | - | Defines the HTTP method used for the request. GET: Data is sent as part of the URL in query parameters POST: Data is sent in the request body |
| transform | transform | string | No | ”transformHistorianMultiValueInputs”, “transformHistorianMultiChartInputs” | "transformHistorianMultiValueInputs", "transformHistorianMultiChartInputs", "transformSmartdashInput", ... | - | Specifies an optional transformation function to apply to input or output data |
| inputs | inputs | array of objects | No | Array of input parameter objects | See individual input parameter rows | - | An array defining the input parameters required by the data source |
| inputs[].name | name | string | Yes | Any machine-friendly string | "AIRPORT_CODE", "tag", "num", "format", "sigids", "headers", "infolevel", "timelevel", "stoptime", "nonunits" | - | A machine-friendly name for the input |
| inputs[].parameterName | parameterName | string | Yes | Any string suitable as a URL or body parameter name | "arr_iata", "timeZone" | - | The name of the parameter as it appears in the URL or request body |
| inputs[].type | type | string | Yes | ”body”, “url”, “get”, “header”, “json” | "body", "url", "get", "header", "json" | - | Specifies where the input parameter should be placed in the request |
| inputs[].format | format | object | No | Object with “type”, “pattern”, and optionally “timeZone” (for “date” type) | See individual format properties | - | Defines the format of the input value, especially useful for dates |
| inputs[].format.type | type | string | No | ”date” | "date" | - | The data type of the input format. Currently, “date” is mentioned |
| inputs[].format.pattern | pattern | string | No | Any valid date-fns format string (ref: https://date-fns.org/v2.30.0/docs/format) | "yyyy-MM-dd'T'HH:mm:ssXX", "dd'.'MM'.'yyyy" | - | The format pattern for date inputs |
| inputs[].format.timeZone | timeZone | string | No | Any valid timezone identifier (e.g., “CEST”) | "CEST" | - | The timezone for date inputs |
| inputs[].label | label | string | No | Any user-friendly string | "3 letter airport code, e.g. LGW or JFK", "Tag", "Product number" | - | A user-friendly label displayed above the input field in the UI |
| inputs[].default | default | string | No | Any string appropriate for the input type | "csv", "AMX-PC-DAY-AMX-OIWD,AMX-PI-DAY-AMX-OIWAPR,...", "STOP_TIME", "now", "1" | - | The default value to use if the user does not provide an input |
| inputs[].multi | multi | boolean | No | true, false | TRUE | FALSE | Indicates if multiple values can be selected for this input |
| inputs[].encode | encode | boolean | No | true, false | TRUE | FALSE | Indicates if the input value should be URL-encoded |
| inputs[].transform | transform | string | No | ”transformSmartdashInput” | "transformSmartdashInput" | - | Specifies a specific transformation for this input |
| inputs[].isRequired | isRequired | boolean | No | true, false | TRUE | FALSE | Indicates if this input is mandatory |
| inputs[].isAdvanced | isAdvanced | boolean | No | true, false | TRUE | FALSE | Indicates if this input should be hidden under an “Advanced” section in the UI. |
| inputs[].isChartStart | isChartStart | boolean | No | true, false | TRUE | FALSE | If true, indicates this input will use the chart’s start time. Only applicable to data sources supporting charts. |
| inputs[].isChartEnd | isChartEnd | boolean | No | true, false | TRUE | FALSE | If true, indicates this input will use the chart’s end time. Only applicable to data sources supporting charts. |
| inputs[].isHidden | isHidden | boolean | No | true, false | TRUE | FALSE | Will not be visible to the user through the UI but is available to configure the data source. |
| inputs[].isCode | isCode | string | No | ”sql” | "sql" | - | If set to “sql”, it will display an SQL formatted text box for user input. |
| inputs[].isConfigurable | isConfigurable | boolean | No | true, false | TRUE | FALSE | Indicates if this should be shown as an input during data source installation. |
| inputs[].showBasket | showBasket | boolean | No | true, false | TRUE | FALSE | Means it can be added to the basket (presumably for bulk actions). |
| inputs[].showTagEdit | showTagEdit | boolean | No | true, false | TRUE | FALSE | Will show the search icon (likely for searching tags). |
| inputs[].showStaleAfter | showStaleAfter | boolean | No | true, false | TRUE | FALSE | Enables the staleness indicator on components, useful for live or frequently changing data. |
| output | output | object | No | Object defining the output data (see rows below for details) | See individual output properties | - | Defines the data that the data source template will return. |
| output.paths | paths | array of objects | Yes | Array of output path objects (see rows below for details of each object) | See individual output path properties | - | Defines an array of objects, where each object defines an output field. |
| output.paths[].name | name | string | Yes | Any human-readable string | "biomass", "value", "x", "AMX-PC-DAY-AMX-OIWD" | - | The human-readable name you would like to use for the output field. |
| output.paths[].path | path | string | Yes | Any valid JSONPath expression | "$.data.generationmix[?(@.fuel === 'biomass')].perc", "*.STOP_TIME" | - | The JSONPath to locate the desired value in the API response. |
| output.paths[].type | type | string | No | e.g., “date” | "date" | - | The data type of the output value. |
| output.paths[].label | label | string | No | Any helpful string | - | Helpful text to show by the field for the user. | |
| output.paths[].default | default | string | No | Any string appropriate for the output type | - | The default value for the parameter if one is not entered in the API response. | |
| output.paths[].format | format | object | No | Object with “type” and “pattern” (for “date” type) | See individual format properties | - | Defines the format of the output value, especially for dates. |
| output.paths[].format.type | type | string | Yes | e.g., “date” | "date" | - | The data type of the output format. Currently, “date” is mentioned. |
| output.paths[].format.pattern | pattern | string | No | Any valid date-fns format string (ref: https://date-fns.org/v2.30.0/docs/format) | "yyyy-MM-dd'T'HH:mm:ssXX", "dd'.'MM'.'yyyy" | - | The format pattern for date outputs. |
| output.transform | transform | string | No | ’transformSmartdash’, ‘transformHistorianServlet’ | "transformSmartdash", "transformHistorianServlet", "transformHistorianMultiValue" | - | Specifies an optional transformation function to apply to the output data. |
| headers | headers | object of key-value pairs | No | Any valid HTTP headers | {"Authorization": "..."}, {"Content-Type": "application/json"} | - | An optional object containing key-value pairs representing custom headers to be included in the API request. |
| headers.Authorization | Authorization | string | No | Any valid authorization token | - | Example of a custom header for authorization. | |
| useProxy | useProxy | boolean | No | true, false | true, false | FALSE | Indicates whether the API request should be sent via a proxy. |
| trendWith | trendWith | string | No | Data source ID of a data source with a trendable version of the parameter | "historian-multi-chart" | - | Optional data source ID of data with a trendable version of the parameter. |
| compatibleWith | compatibleWith | array of strings | Yes | ”table”, “chart”, “value”, “multivalue” | ["table"], ["chart", "value"] | - | Defines the types of components that can use the data from this data source. |
| batchSize | batchSize | number | No | Any positive integer | 100 | - | An optional number specifying the batch size for requests. |
| isTrendable | isTrendable | boolean | No | true, false | TRUE | FALSE | An optional boolean indicating if the data from this source can be used in trends. |
| isWriteable | isWriteable | boolean | No | true, false | TRUE | FALSE | An optional boolean indicating if data can be written back to this source. |
| errorPath | errorPath | object | No | Object with “label” and “message” properties | {"message": "$.error.message"} | - | An optional object defining the path to error information in the response. |
| errorPath.label | label | string | No | Any helpful string | - | Helpful text for the error message field. | |
| errorPath.message | message | string | Yes | Any JSONPath expression | "$.error.message" | - | The JSONPath to the error message in the response. |
| format | format | object | No | Object with “type” (“json” or “csv”) and optional “options” | {"type": "csv", "options": {"delimiter": ";"}}, {"type": "json"} | - | An optional object defining the overall format of the API response. |
| format.type | type | string | Yes | ”json”, “csv” | "json", "csv" | - | The type of the API response format. |
| format.options | options | object | No | Format-specific options (e.g., {“delimiter”: ”;”}) for CSV | {"delimiter": ";"} | - | Format-specific options, such as the delimiter for CSV. |
| format.options.delimiter | delimiter | string | No | Any string to be used as a delimiter | ";" | - | The delimiter for CSV formatted responses. |
| concurrentSize | concurrentSize | number | No | Any positive integer | - | An optional number specifying the number of concurrent requests. | |
| isUnique | isUnique | boolean | No | true, false | FALSE | An optional boolean indicating if the data should be unique. | |
| writeWith | writeWith | string | No | Another data source ID | - | An optional string specifying another data source ID to use for writing data. | |
| function | function | string or function definition | No | ’staticChart’ or a JavaScript function | 'staticChart', (args: any) => Promise or Record<[]> | - | An optional function to be executed for data retrieval or transformation. |
| Metadata.Name | Name | string | Yes | Any descriptive string | "UK Carbon Intensity", "Eigen Ingenuity Historian" | - | The user-friendly name of the data source. |
| Metadata.nameID | nameID | string | Yes | Any machine-friendly string without spaces | "uk-carbon-intensity", "eigen-historian" | - | The machine-friendly name of the datasource used by the code. |
| Metadata.Description | Description | string | No | Any detailed explanation | "Queries the UK carbon intensity API...", "Connects to the Eigen Ingenuity Historian servlet..." | - | A detailed explanation of the data source, including any limitations. |
| Metadata.Image | Image | string | No | Path or URL to an image file (png, jpg, svg) | - | Optional image to help users identify the data source. This variable is configured automatically by the Upload Image wizard. |
: Table 3.1 Data source configuration parameters
4 Using Data Sources
Section titled “4 Using Data Sources”4.1 Viewing the data sources
Section titled “4.1 Viewing the data sources”To see a list of all the configured custom data sources, click on Data sources in the left-hand menu. See section 1.6.
4.2 Using a data source
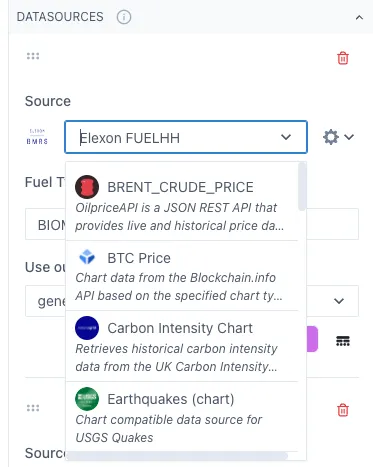
Section titled “4.2 Using a data source”The Source field in the “Value” section of a component lists all the available data sources for that component (see section 1.5)
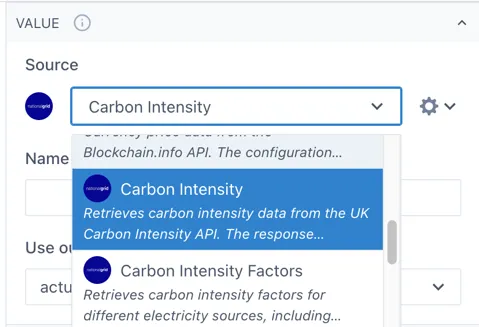
Scroll down the list or start typing the name of the data source you would like to use.
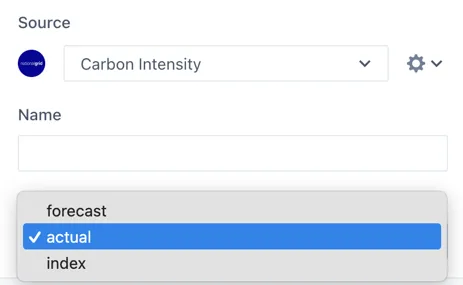
If there are any required inputs or available options for the selected data source, these will appear under the source field.
For example, this Carbon Intensity data source has three available outputs to choose from.
5 Installing an Eigen Ingenuity Driver
Section titled “5 Installing an Eigen Ingenuity Driver”Eigen Ingenuity drivers connect to 3^rd^ party data sources and provide a secure web API that can then be configured as a data source. They manage all technical aspects including authorization and interface protocols and address any restrictions such as query size limitations, response size limits (e.g. maximum number of rows) or missing functionality (for example, aggregates) so that the user experience is consistent across all data sources.
Setting up an Eigen Ingenuity driver requires two steps:
-
Driver installation and configuration
-
Driver registration with the back-end
5.1 Driver Installation
Section titled “5.1 Driver Installation”Eigen Ingenuity drivers are individually licenced components. The software will be provided by your Eigen contact, along with installation instructions, as part of the installation and set-up process.
5.2 Driver registration
Section titled “5.2 Driver registration”Warning
The Ingenuity Diagnostics module can make critical system changes that might render the system inoperable, potentially requiring reinstallation. For this reason, write permissions for the Ingenuity Diagnostics module are restricted to organizations with Gold-level or higher support subscriptions and at least one Eigen-certified system administrator.
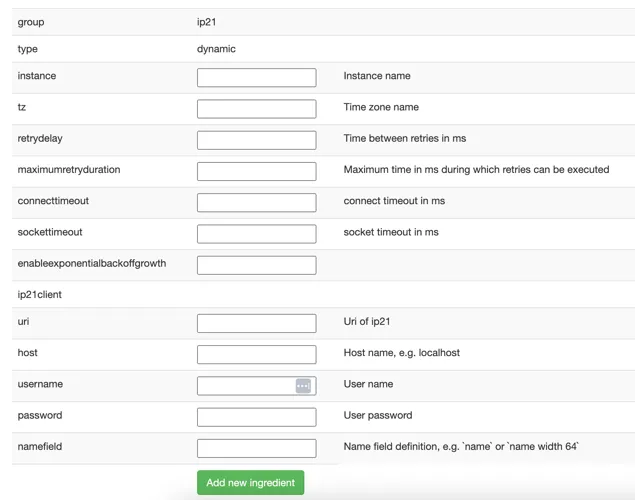
Once the driver is installed it must be registered as an Ingredient in the Ingenuity Diagnostics module by completing the relevant template. This will manage the configuration of the driver and register it as a data source.
The example below is the template for registering a new IP.21 driver instance.
6 Worked Examples
Section titled “6 Worked Examples”The following section contains some worked examples. These examples are used as the basis for the worked examples in the Dashboards. Access to Ingenuity Hub within your subscription is required for all of these examples as they must be created as a Datasource Template first.
6.1 UK Postcode Finder
Section titled “6.1 UK Postcode Finder”The https://api.postcodes.io/api is an open API for finding information about UK postcodes.
Access Ingenuity Hub by clicking on your user in the bottom left corner and selecting “Ingenuity Hub”
Go to the “Datasource templates” tab and click the [Add datasource template] button:
A new blank data source from will open including an template for configuring the data source.
6.1.1 Enter the metadata
Section titled “6.1.1 Enter the metadata”Enter the following data at the top of the form:
Name: Postcode Info
nameID: postcodes
Description: Use the docs from the API to put together a useful description for users:
Search the web for a suitable logo and upload it.
6.1.2 Configure the data source
Section titled “6.1.2 Configure the data source”From the docs we see that the structure of a request is
https://api.postcodes.io/postcodes/postcodeThe request can be a GET or a POST. We will use the GET method to keep it simple here.
Therefore, the first two lines of the datasource are:
"url": "https://api.postcodes.io/postcodes/{{postcode}}","type": "GET",6.1.3 Configure the inputs
Section titled “6.1.3 Configure the inputs”The only input is the postcode we want to retrieve data for. The default template has two inputs. Delete the second one (don’t forget to delete the comma after the first one) and configure the remaining input as follows:
"inputs": [ { "name": "postcode", "type": "url", "label": "Postcode", "isHidden": false, "isRequired": true, "description": "The postcode to get information about", "isConfigurable": false }],6.1.4 Configuring the outputs
Section titled “6.1.4 Configuring the outputs”The outputs are configured in the output section and as a minimum require a “name” and “path”.
"output": { "paths": []}The path is the json path expression to extract the data from the API response
With the inputs set, we can now use the Test button at the in the Preview section to check the response from the API. Enter a postcode (e.g. W12 7FW) and click Test. You should see the following in the Response window:
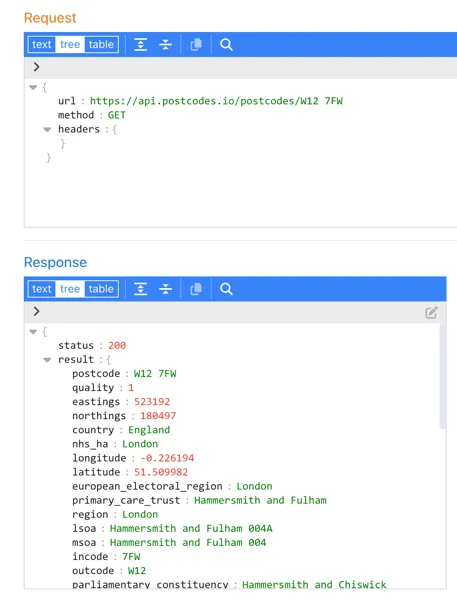
Explore the response to find the data you would like. For the purpose of this example, we are going to return the latitude and longitude, region, district and parliamentary constituency.
The default template only has one output, so we will need to copy this several times. Don’t forget to add the comma (,) at the end of each output except the last one.
The minimum configuration required for the outputs section is therefore:
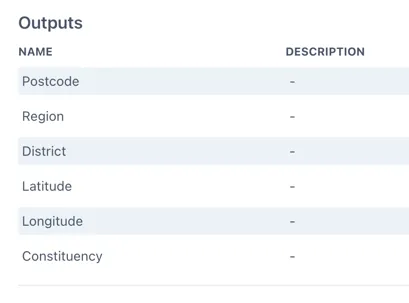
"output": { "paths": [ { "name": "Postcode", "path": "$.result.postcode" }, { "name": "Region", "path": "$.result.region" }, { "name": "District", "path": "$.result.admin_district" }, { "name": "Latitude", "path": "$.result.latitude" }, { "name": "Longitude", "path": "$.result.longitude" }, { "name": "Constituency", "path": "$.result.parliamentary_constituency_2024" } ]},If we leave it like this the data source will work but it is not very user friendly as, if a user clicks on the “Details” button by the data source this is what they will see:
It is a good idea to add a description to each output so that it shows up in the information about the data source for a user. Information on all the outputs can be found in the API docs here: https://api.postcodes.io/docs
A fully configured data source output section would look like this:
{ "name": "District", "path": "$.result.admin_district", "type": "string", "description": "The current district/unitary authority to which the postcode has been assigned."},Configure the remaining sections
Section titled “Configure the remaining sections”The datasource is available on the internet so we do not need to use the back-end proxy. The outputs we have configured are compatible with a table and a multi-value components;
"useProxy": false,"compatibleWith": [ "table", "multivalue"]Save the data source template by clicking the Update button at the bottom of the form:

6.1.5 Challenge — improving the data source to handle partial postcodes
Section titled “6.1.5 Challenge — improving the data source to handle partial postcodes”The postcodes api has a query method that will return results for partial postcodes:
https://api.postcodes.io/postcodes?q=[query]
Have a go at modifying the data source to support this.
Examples of how to modify the inputs and outputs
Section titled “Examples of how to modify the inputs and outputs”The inputs section does not change but the url becomes:
"url": "https://api.postcodes.io/postcodes?q={{postcode}}",The path in the outputs must be updated to include the * to identify each result in the returned array
"path": "$.result.*.postcode",6.2 Flight Radar 24 Datasource
Section titled “6.2 Flight Radar 24 Datasource”This data source accesses publicly available flight data from FlightRadar24.
Access Ingenuity Hub by clicking on your user in the bottom left corner and selecting “Ingenuity Hub”
Go to the “Datasource templates” tab and click the [Add datasource template] button:
6.2.1 Enter the metadata
Section titled “6.2.1 Enter the metadata”Enter the following data:
Name: FlightRadar24
nameID: flightradar24
Description: Use the docs from the API to put together a useful description for users: https://fr24api.flightradar24.com/docs/getting-started
Search the web for a FlightRadar24 logo and upload it.
6.2.2 Configure the data source
Section titled “6.2.2 Configure the data source”The URL of the API is: https://api.flightradar24.com/common/v1/airport.json
The request is a standard “GET” request where the parameters are appended to the end of the request, i.e.
<api>?parametersTherefore, the first two lines of the datasource are:
"url": "https://api.flightradar24.com/common/v1/airport.json","type": "GET",Before we can test the data source we may need to force it to use the Proxy service (i.e. be sent from the back-end server rather than the users machine) and we may as well take the time to also configure the “compatibleWith” parameters. Configure the following parameters;
"useProxy": false,"compatibleWith": [ "table"]if there are any cross site scripting limitiations or users machines do not have access to the data source. Configure the useProxy as “true”
6.2.3 Configure the inputs
Section titled “6.2.3 Configure the inputs”There are three inputs;
code: Required - The IATA or ICAO code for the airport
format: optional json or csv
limit: optional the maximum number of records returned
Therefore the inputs section of the data source is configured as follows:
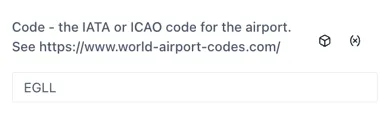
"inputs": [ { "name": "code", "type": "get", "label": "Code - the IATA or ICAO code for the airport. See https://www.world-airport-codes.com/", "description": "IATA codes are three-letter identifiers used in ticketing and passenger systems, while ICAO codes are four-letter identifiers used by air traffic control" }, { "name": "format", "type": "get", "default": "json", "label": "Optional. The format of the dataset to return", "description": "The format of the dataset to return" }, { "name": "limit", "type": "get", "default": 10 }]When no “label” property is set, the input field will show the name:
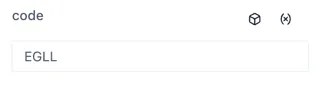
Setting the “label” property helps users and makes the data source easier to use:
Configuring the outputs
Section titled “Configuring the outputs”The outputs are configured in the output section and as a minimum require a “name” and “path”.
"output": { "paths": []}The path is the json path expression to extract the data from the API response
With the inputs set, we can now use the Test button at the in the Preview section to check the response from the API. Enter an airport code (e.g. LHR) and click Test. You should see the following in the Response window:
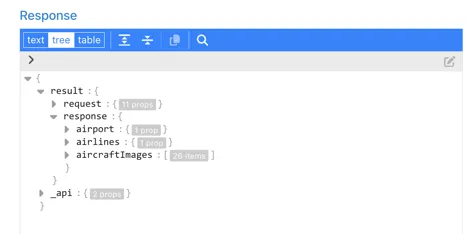
Explore the response to find the data you would like. For the purpose of this example, we are going to use the data in the $.result.response.airport.plugindata section:
Configure the outputs you would like to return.
To make it easy for users, all the outputs are prefixed with Arrival or Departure so that they are grouped in the dropdown selection. This makes it easy for users to find the right field.
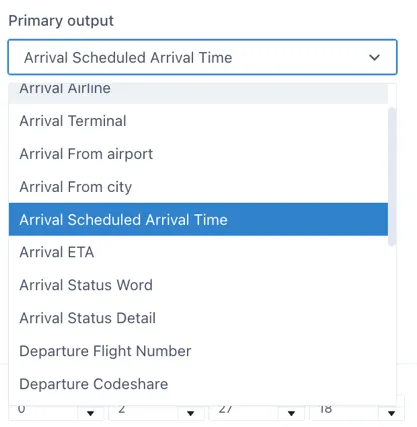
For the purpose of this exercise, we will look at the configuration of 2 examples as this covers the two data types needed:
-
Arrival Flight Number
-
Arrival Scheduled Arrival Time
Arrival Flight Number
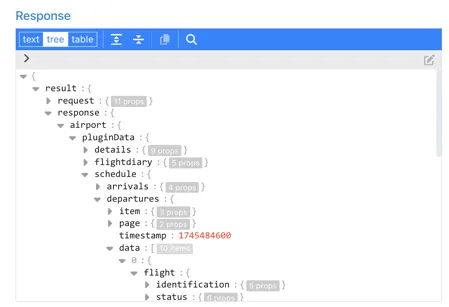
Section titled “Arrival Flight Number”The flight number of arriving flights is found under the ..schedule.arrivals.data.0.flight.identification.id
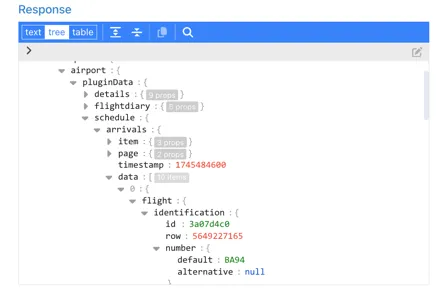
To return all of the records as an object we replace the “0” with ”*”, so the configuration is as follows:
{ "name": "Arrival Flight Number", "path": "$.result.response.airport.pluginData.schedule.arrivals.data.*.flight.identification.number.default", "description": "The commercial flight number, typically assigned by the airline."}Arrival Scheduled Arrival Time
Section titled “Arrival Scheduled Arrival Time”The scheduled arrival time is also in the “flight” section of the response under ..time.scheduled.arrival:
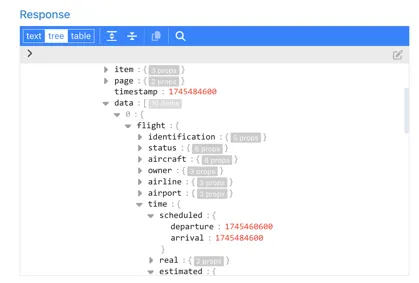
The format is a Unix Epoch Timestamp — a 10-digit number representing the seconds since 01 Jan 1970 UTC. There is no timezone information in the timestamp ( although the timezone of the airport is available in the ..airport.plugindata.details.timezone section of the response)
To make sure that UI components can use this as a true date object, rather than a string, we will specify the data type and format as part of the output:
The matching format code for this format from date-fns.org (https://date-fns.org/v4.1.0/docs/format) is “t”.
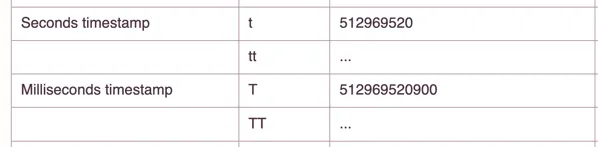
The configuration of the output is:
"name": "Arrival Scheduled Arrival Time","path":"$.result.response.airport.pluginData.schedule.arrivals.data.*.flight.time.scheduled.arrival","format": { "type": "date", "pattern": "t"},Add configuration for any other Arrivals and Departure fields you would like to make available to users.
Save the data source template by clicking the Update button at the bottom of the form:
6.3 Theme Parks data source
Section titled “6.3 Theme Parks data source”This data source connects to publicly available data on major theme parks and their queue times.
Access Ingenuity Hub by clicking on your user in the bottom left corner and selecting “Ingenuity Hub”
Go to the “Datasource templates” tab and click the [Add datasource template] button:
Enter the metadata
Section titled “Enter the metadata”Enter the following data:
Name: Theme Parks
nameID: theme-parks
Description: Use the docs from the API to put together a useful description for users: https://queue-times.com/pages/about
Search the web for an appropriate logo and upload it.
Configure the source
Section titled “Configure the source”The URL of the API is: https://queue-times.com/parks.json
The request is a standard “GET”, therefore, the first two lines of the datasource are:
"url": "<https://queue-times.com/parks.json>","type": "GET",Configuring the other settings
Section titled “Configuring the other settings”Before we can test the data source we may need to force it to use the Proxy service (i.e. be sent from the back-end server rather than the users machine) if there are any cross site scripting limitiations or users machines do not have access to the data source. Configure the useProxy as follows, and we may as well take the time to also configure the “compatibleWith” parameters.
"useProxy": true,"compatibleWith": [ "table", "multivalue", "value"]6.3.3 Configure the inputs
Section titled “6.3.3 Configure the inputs”The URL does not accept any parameters but we would like to have the option to filter out the list of parks for a given company. So we will present the user with an optional input for the companyId and use a JSON path filter to create a custom output with the list we would like ;
companyId: Optional - The id of the company to filter the list of theme parks
Therefore the inputs section of the data source is configured as follows:
"inputs": [ { "name": "companyId", "label": "Company ID (leave blank to return all)", "description": "If null then all companies and parks will be returned" }],6.3.4 Configuring the outputs
Section titled “6.3.4 Configuring the outputs”The outputs are configured in the output section and as a minimum require a “name” and “path”.
"output": { "paths": []}The path is the json path expression to extract the data from the API response
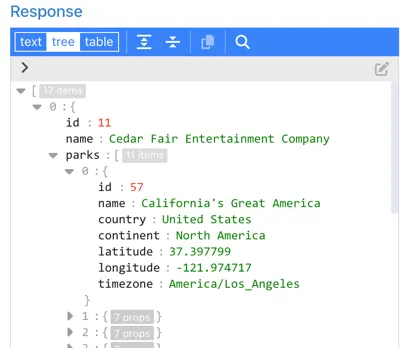
With the inputs set, we can now use the Test button at the in the Preview section to check the response from the API:
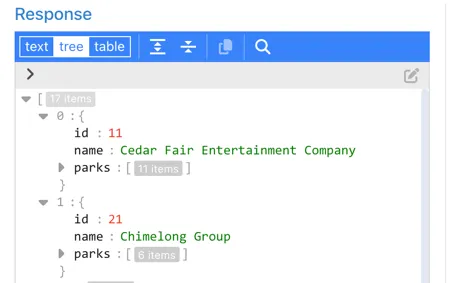
We can see that the list of parks is returned as a sub-document of each company the park details as a further set of sub-documents:
The Company output
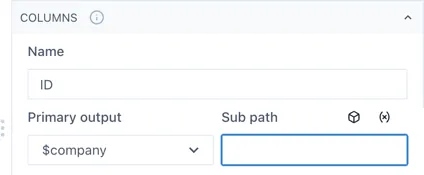
Section titled “The Company output”In this case we are going to return the whole json document for each company and let the user pick the property they want to display as a sub-path. So configure the first output as follows:
"output": { "paths": [ { "name": "$company", "path": "$", "label": "Company [id,name]", "description": "List of all the Companies that have Theme Parks. Has .name and .id properties" }, ]}When a user selects this output in the UI, they will be prompted to enter the sub path (i.e. id or name)
The Parks output
Section titled “The Parks output”For the Parks output we would like to separate the Parks out into a separate field to make it more intuitive for users and so that all the details are available within 1 sub-path. To do this we need to filter the API response to those parks matching the “companyId” in the input, using a JSON path expression that finds all objects in the root array that have an id matching the specified companyId, and then returns the parks property from those objects.
"$[?(@.id==={{companyId}})].parks"-
$ - This represents the root of the JSON document
-
[ ] - Square brackets indicate an array of elements
-
? - signifies the beginning of a filter expression
-
() - round brackets contain the filter expression
-
@ - represents the current object being processed in the filter.
-
@.id==={{companyId}} - elects elements where the id property equals the value of {{companyId}}
-
.parks - After filtering, this selects the parks property from each matched element
The $parks output is therefore configured as follows:
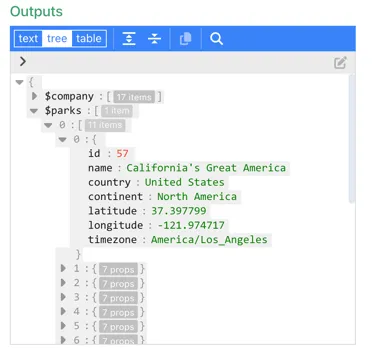
{ "name": "$parks", "path": "$[?(@.id==={{companyId}})].parks", "label": "Parks", "description": "List of all the parks for the selected company"}Now re-check the output by entering a Company ID and you should see something like the following:
Configure the other settings
Section titled “Configure the other settings”The datasource is available on the internet so we do not need to use the back-end proxy. The outputs we have configured are compatible with a table;
"useProxy": false,"compatibleWith": [ "table"]Save the data source template by clicking the Update button at the bottom of the form:
Appendix I – Example Data Source Templates
Section titled “Appendix I – Example Data Source Templates”Typescript definition for a data source
Section titled “Typescript definition for a data source”This is the Typescript definition for a data source in Ingenuity 7.
{ url: string;headers?: Record<string, string>;type: 'POST' | 'GET' | 'POST_FORM';transform?: | 'transformHistorianMultiValueInputs' | 'transformHistorianMultiChartInputs';inputs: { name: string; isChartStart?: boolean; isChartEnd?: boolean; label?: string; description?: string; multi?: boolean; default?: string; type: 'body' | 'url' | 'get' | 'header' | 'json'; isRequired?: boolean; isAdvanced?: boolean; isHidden?: boolean; isCode?: 'sql'; isConfigurable?: boolean; parameterName?: string; format?: { type: string; pattern: string; timeZone?: string; }; transform?: 'transformSmartdashInput'; showTagEdit?: boolean; showBasket?: boolean; showStaleAfter?: boolean;}[];output: { paths: { name: string; label?: string; description?: string; path: string; format?: { type: string; pattern: string; }; }[]; transform?: | 'transformSmartdash' | 'transformHistorianServlet' | 'transformHistorianServletSingle' | 'transformHistorianMultiValue' | 'transformHistorianMultiChart';};errorPath?: { label?: string; message: string;};format?: { type: 'json' | 'csv'; options: Record<string, unknown>;};batchSize?: number;concurrentSize?: number;compatibleWith?: AllWidgetKinds[];useProxy?: boolean;isUnique?: boolean;isTrendable?: boolean;isWriteable?: boolean;trendWith?: string;writeWith?: string;function?: | 'staticChart' | (( args: any, ) =Promise<Record<string, unknown> | Record<string, unknown>[]>); };};Open API with no inputs — value and multivalue
Section titled “Open API with no inputs — value and multivalue”This data source queries the UK carbon intensity API (an open API) and returns the current carbon intensity value of each type (biomass, coal, imports, gas, nuclear, other, hydro, solar & wind).
{ "url": "https://api.carbonintensity.org.uk/generation", "type": "GET", "inputs": [], "output": { "paths": [ { "name": "biomass", "path": "$.data.generationmix[?(@.fuel === 'biomass')].perc" }, { "name": "coal", "path": "$.data.generationmix[?(@.fuel === 'coal')].perc" }, { "name": "imports", "path": "$.data.generationmix[?(@.fuel === 'imports')].perc" }, { "name": "gas", "path": "$.data.generationmix[?(@.fuel === 'gas')].perc" }, { "name": "nuclear", "path": "$.data.generationmix[?(@.fuel === 'nuclear')].perc" }, { "name": "other", "path": "$.data.generationmix[?(@.fuel === 'other')].perc" }, { "name": "hydro", "path": "$.data.generationmix[?(@.fuel === 'hydro')].perc" }, { "name": "solar", "path": "$.data.generationmix[?(@.fuel === 'solar')].perc" }, { "name": "wind", "path": "$.data.generationmix[?(@.fuel === 'wind')].perc" } ] }, "useProxy": false, "compatibleWith": [ "value", "multivalue" ]}The “path” parameter in each output contains a json path query because the returned data contains a list that could be in any order as shown below
{ "data": { "from": "2024-12-10T09:00Z", "to": "2024-12-10T09:30Z", "generationmix": [ { "fuel": "biomass", "perc": 6 }, { "fuel": "coal", "perc": 0 }, { "fuel": "imports", "perc": 5 }, { "fuel": "gas", "perc": 55.1 }, { "fuel": "nuclear", "perc": 8.1 }, { "fuel": "other", "perc": 0 }, { "fuel": "hydro", "perc": 1.3 }, { "fuel": "solar", "perc": 0.6 }, { "fuel": "wind", "perc": 23.9 } ] }}Timeseries historian data source — Historian Multi
Section titled “Timeseries historian data source — Historian Multi”This data source connects to the Eigen Ingenuity Historian servlet and makes all available historians accessible from the UI. It only needs to be configured once.
{ "url": "https://ingenuity.eigen.co/historian-servlet/multi", "type": "POST", "inputs": [ { "name": "tag", "type": "body", "label": "Tag", "multi": true, "encode": true, "isRequired": true, "showBasket": true, "showTagEdit": true, "showStaleAfter": true } ], "output": { "paths": [ { "name": "value" }, { "name": "timestamp" } ], "transform": "transformHistorianMultiValue" }, "useProxy": true, "batchSize": 100, "transform": "transformHistorianMultiValueInputs", "trendWith": "historian-multi-chart", "isTrendable": true, "isWriteable": true, "compatibleWith": [ "value", "multivalue" ]}Importing a CSV data source from an API
Section titled “Importing a CSV data source from an API”This data source accesses an API that returns a comma separated values (csv) dataset.
{ "url": "http://192.168.1.1/AjaxServer/GetDataResult.aspx", "type": "GET", "format": { "type": "csv", "options": { "delimiter": ";" } }, "inputs": [ { "name": "format", "type": "get", "default": "csv" }, { "name": "sigids", "type": "get", "default": "AMX-PC-DAY-AMX-OIWD,AMX-PI-DAY-AMX-OIWAPR,AMX-PI-DAY-AMX-OIWEPC,AMX-PB-DAY-AMX-BSW,AMX-PI-DAY-AMX-OIDRAIN,AMX-WC-DAY-AMX-WATEP-M3,AMX-WC-DAY-AMX-WATPR-M3,AMX-WC-DAY-AMX-WATD-M3" }, { "name": "headers", "type": "get", "default": "STOP_TIME" }, { "name": "infolevel", "type": "get", "default": "DAY" }, { "name": "timelevel", "type": "get", "default": "WEEK" }, { "name": "stoptime", "type": "get", "default": "now" }, { "name": "nounits", "type": "get", "default": "1" } ], "output": { "paths": [ { "name": "x", "path": "*.STOP_TIME", "format": { "type": "date", "pattern": "dd'.'MM'.'yyyy" } }, { "name": "AMX-PC-DAY-AMX-OIWD", "path": "*.AMX-PC-DAY-AMX-OIWD" }, { "name": "AMX-PI-DAY-AMX-OIWAPR", "path": "*.AMX-PI-DAY-AMX-OIWAPR" }, { "name": "AMX-PI-DAY-AMX-OIWEPC", "path": "*.AMX-PI-DAY-AMX-OIWEPC" }, { "name": "AMX-PB-DAY-AMX-BSW", "path": "*.AMX-PB-DAY-AMX-BSW" }, { "name": "AMX-PI-DAY-AMX-OIDRAIN", "path": "*.AMX-PI-DAY-AMX-OIDRAIN" }, { "name": "AMX-WC-DAY-AMX-WATPR-M3", "path": "*.AMX-WC-DAY-AMX-WATPR-M3" }, { "name": "AMX-WC-DAY-AMX-WATEP-M3", "path": "*.AMX-WC-DAY-AMX-WATEP-M3" }, { "name": "AMX-WC-DAY-AMX-WATD-M3", "path": "*.AMX-WC-DAY-AMX-WATD-M3" } ] }, "useProxy": true, "compatibleWith": [ "chart" ]}Example Timeseries historian data source — Blockchain.info API
Section titled “Example Timeseries historian data source — Blockchain.info API”This data source retrieves data from the Blockchain.info API based on the specified chart type and timespan. It returns timestamps and corresponding values for visualization in chart and table formats..
{ "url": "https://api.blockchain.info/charts/{{type}}", "type": "GET", "inputs": [ { "name": "cors", "default": "true", "isHidden": true, "description": "Handles Cross-Origin Resource Sharing (CORS) requests. This field is hidden and set to true." }, { "name": "format", "default": "json", "isHidden": true, "description": "Specifies the format for the response data. This field is hidden and set to 'json'." }, { "name": "type", "type": "url", "label": "Chart type", "default": "market-price", "isRequired": true, "description": "Specifies the type of chart to be retrieved, such as 'market-price'." }, { "name": "timespan", "type": "get", "label": "Timespan", "default": "4weeks", "isRequired": true, "description": "Defines the timespan for the data to be retrieved, such as '4weeks'." }, { "name": "start", "type": "get", "format": { "type": "date", "pattern": "yyyy-MM-dd'T'hh:mm:ss" }, "isAdvanced": true, "description": "Specifies the start date and time for the data retrieval period.", "isChartStart": true } ], "output": { "paths": [ { "name": "x", "path": "$.values.*.x", "format": { "type": "date", "pattern": "t" }, "description": "Provides the timestamp for each data point in the retrieved chart." }, { "name": "price", "path": "$.values.*.y", "description": "Represents the value of the data point, such as the price for each timestamp in the chart." } ] }, "useProxy": false, "compatibleWith": [ "chart", "table" ]}End of Document
For more information, please contact us at <info@eigen.coor book a demo on our website at www.eigen.co
Footnotes
Section titled “Footnotes”-
See documentation here: https://docs.oracle.com/cd/E60058_01/PDF/8.0.8.x/8.0.8.0.0/PMF_HTML/JsonPath_Expressions.htm
And example implementation here https://jsonpath-plus.github.io/JSONPath/demo/ ↩